Approximate Read Time: 13 Minutes
“DEXA isn’t about body fat. It’s a diagnostic map of muscle, bone, and balance that predicts how athletes perform, recover, and endure.”
What You Will Learn
- DEXA reveals functional symmetry and lean-mass distribution linked to injury resilience.
- Lean-mass indices from DEXA quantify performance potential and biological reserve.
- Routine DEXA monitoring validates adaptation, guiding training and nutritional precision.
DEXA Beyond Aesthetics
In October 2025, my DEXA scan returned a familiar set of numbers: body fat 12.5 %, ALMI 9.22 kg/m², and a T-score of +1.8. For most, that would mark the end of the conversation—confirmation of fitness, perhaps a vanity metric to track quarterly.
For me, it marked the beginning of an audit.
As a clinician and performance therapist, I have long used DEXA as a diagnostic lens rather than a scoreboard. Its precision allows us to quantify structural readiness and how much lean tissue we carry, how symmetrically it’s distributed, and how bone supports the mechanical demands of training. But precision only matters when it’s anchored to reference data. The challenge has always been context: what is normal, what is optimal, and what is potentially predictive?
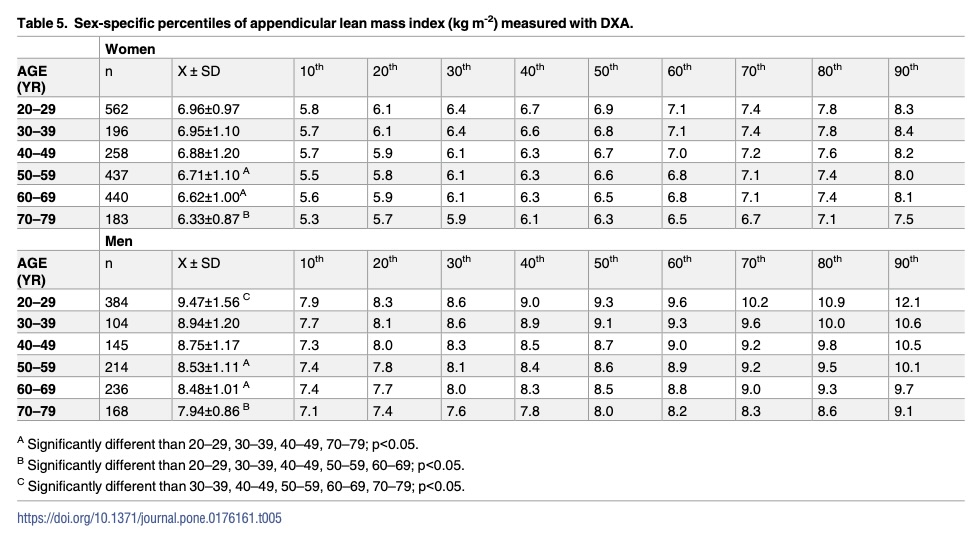
Two key studies now give us that framework. Imboden et al. (2017) provided GE-Healthcare-specific normative values for lean mass and appendicular indices across 3,327 adults, while Kouri et al. (1995) established the natural ceiling of fat-free-mass index (FFMI) attainable without pharmacologic enhancement. Together, they upgrade DEXA from descriptive to diagnostic.
Why DEXA Remains the Gold Standard for Lean-Mass Profiling
Dual-energy X-ray absorptiometry partitions the body into bone mineral content, fat mass, and lean soft tissue, producing highly reproducible regional and total measures. Its coefficient of variation ≈ 1 % far outperforms electrical impedance (InBody) or anthropometric methods (traditional calibers), and its agreement with CT/MRI lean-mass quantification ranges from r² = 0.86 to 0.96 (Imboden, 2017).
Unlike caliper or impedance testing, DEXA distinguishes not only how much muscle exists but where it resides. This is a critical determinant of strength, symmetry, and performance durability. Imboden’s dataset of more than 3,000 people confirmed clear sex and age trends:
- Men averaged higher total lean mass (≈ 60.8 kg) and ALMI (≈ 8.8 kg/m²) than women (≈ 42.3 kg; 6.8 kg/m²).
- Both sexes demonstrated a 2–3 % decline per decade, primarily from reduced limb lean mass.
- The 20–29 year male cohort’s mean ALMI = 9.47 kg/m², falling to 7.94 kg/m² by 70–79 years, a 16 % drop across adulthood.
These benchmarks allow us to interpret individual results against validated percentiles rather than anecdotal norms.

Understanding Key DEXA Metrics
Appendicular Lean-Mass Index (ALMI)
ALMI = (Arm Lean Mass + Leg Lean Mass) / Height²
ALMI approximates skeletal muscle capacity normalized to your height. It correlates strongly with functional strength.
In Imboden’s male reference set, median ALMI for ages 30–39 = 8.9 kg/m² (50th percentile), with the 70th percentile ≈ 9.6 kg/m². My measured 9.22 kg/m² falls between those anchors. Athletic but improvable.
Sarcopenia thresholds derived from the same dataset define 6.35 kg/m² (men) and 4.92 kg/m² (women) as > 2 SD below young-adult means. In practice, performance specialists should treat values > 9.0 kg/m² as a functional baseline for healthy men in their 30s and > 10 kg/m² as a target for strength- and power-dependent athletes.
ALMI’s gradual decline of ~0.3 kg/m² per decade underscores why resistance training across the lifespan is a biological necessity, not an aesthetic preference.

Lean-Mass Index (LMI)
Lean Mass Index (LMI) = Lean Mass (kg) ÷ Height² (m²)
Imboden et al. reported a male mean LMI = 19.2 ± 2.4 kg/m² and female = 15.7 ± 2.2 kg/m² across age groups. LMI adjusts total lean mass for stature, revealing how muscle scales relative to frame size.
These normative values are important for general health and performance. Exclusively to sports, we have to consider positional demand and sport type. Football linebackers versus soccer midfielders are going to have different needs. In my opinion, any athlete should be a minimum 50th percentile regardless of their sport.

Fat-Free-Mass Index (FFMI)
FFMI = Fat-Free Mass (kg) / Height² (m²) + 6.1 × (1.8 – height m)
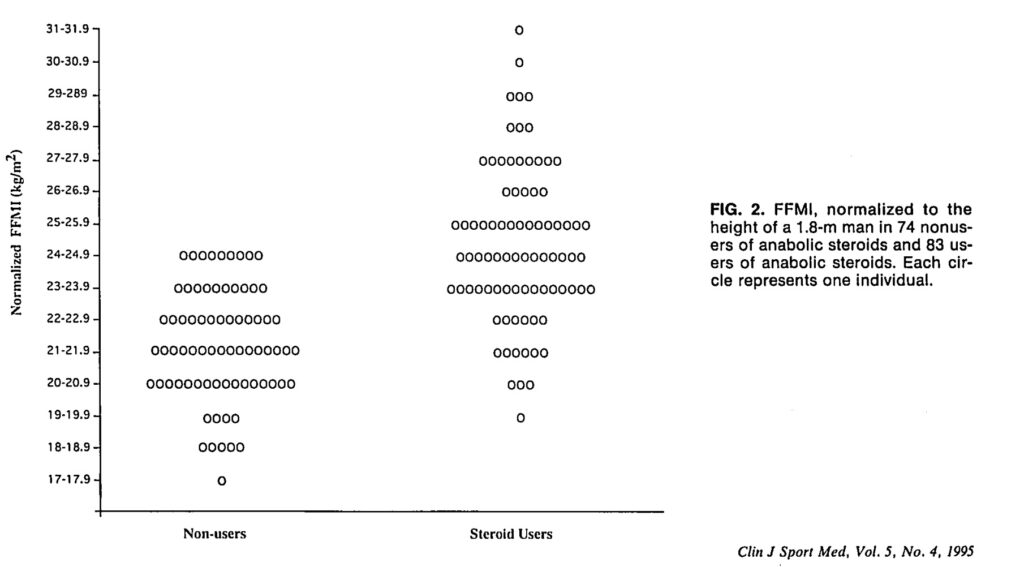
The analysis by Kouri et al. (1995) evaluated 157 male athletes, 83 steroid users and 74 non-users, and established a physiologic upper boundary for natural muscularity.

Among non-users, mean FFMI = 21.8 ± 1.8 kg/m²; the highest natural outliers reached ≈ 25 kg/m². In contrast, steroid users often exceeded 27–30.
My calculated FFMI ≈ 19.1 kg/m² places me slightly below the average male in this study. Not bad, not great. Could be better. It’s a data point to guide decisions for me on my own training and nutrition plan.
Aside from programming deciions, we can use an FFMI as a screening tool. An FFMI > 25 could suggest either exceptional genetics or exogenous influence. Values between 22 and 25 represent the functional “high-performance natural ceiling.”

Percent Lean Mass (% LM)
% Lean Mass = (Lean Mass ÷ Total Body Mass) × 100
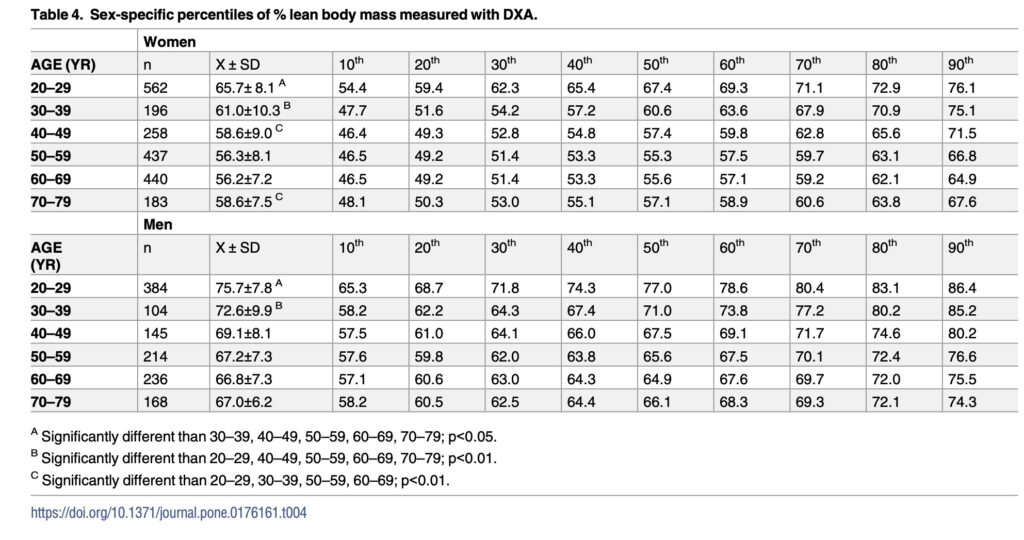
Imboden’s cohort data show mean male % LM = 69.6 ± 8.8 % and female = 59.3 ± 9.3 %. Percent LM declined steadily through midlife, stabilizing near 66–67 % in men and 56 % in women by age 70. For active adults, sustaining > 70 % LM correlates with improved muscle and metabolic health with a propensity towards lower risk for injury.

4 Quick Ways to Use these Key DEXA Metrics
- Risk Stratification: Align ALMI percentile with injury surveillance data. Athletes below 50th percentile will have a relative increased injury risk to those with larger ALMI
- Screening: Identify deficits ( ALMI < 8.0 men / < 6.0 women ) linked to diminished strength and higher injury relative injury risk
- Performance Benchmarking: Track ALMI and LMI longitudinally; a > 1 % drop quarter-to-quarter warrants training and nutritional review.
- Physiologic Ceiling: Use FFMI ≈ 25 kg/m² as a biological upper limit for natural muscular development
Symmetry and the Predictive Power of Regional DEXA Data
The evolution of DEXA from diagnostic imaging to performance profiling rests in its ability to segment data regionally. While total lean-mass values describe capacity, side-to-side symmetry describes control. Imboden’s dataset included both arm LM and leg LM, allowing the calculation of appendicular asymmetry. This is an important consideration in post-operative or long-term rehab.
Across more than 3,000 adults, men demonstrated a 5 – 6 % greater leg LM than women, but the relative symmetry between right and left limbs remained within 3 % (Imboden. 2017). Trusted companies like Dexalytics interprets this variance pragmatically: asymmetries greater than 10 % in limb lean mass often correlate with increased soft-tissue injury incidence and longer rehabilitation timelines.
For context, my October 2025 scan identified a 5.6 % right-dominant leg difference, consistent with Imboden’s normative range yet nearing Dexalytics’ caution threshold for unilateral sport exposure.
Symmetry acts as a simple but sensitive marker for load distribution efficiency. In field and court sports, where mechanical asymmetries accumulate through repetitive directionality, maintaining limb LM within ~5 % difference is considered ideal for minimizing movement compensations.
Bone Density: The Structural Signature of Load History

DEXA’s origin in bone research remains relevant to sport. Bone density functions as a retrospective history of load exposure. The higher the mechanical strain over years of training, the greater the regional BMD.
In Dexalytics’ cross-sport dataset, athletes engaging in high-impact or resistance modalities (basketball, soccer, track sprints) frequently display T-scores > +1.0, reflecting dense cortical structure and reduced risk for stress injury. Conversely, endurance athletes or post-immobilization cases often show mild reductions in BMD despite robust cardiovascular conditioning.
My scan’s T-score = +1.8 situates well above the population mean (0 ± 1 SD). The higher the T-score, the lower the relative risk for bone fracture. Maintaining such values demands continued mechanical loading such as impact, plyometric, or resistance. BMD declines when strain frequency falls below the bone’s remodeling threshold.
Visceral Adipose Tissue: VAT
While neither Imboden et al. nor Kouri et al. directly examined VAT, Dexalytics integrates it into the DEXA analytic suite as a surrogate marker of metabolic stress.
Across professional and collegiate athlete datasets, VAT < 100 cm² is consistently associated with favorable cardiometabolic panels—normal HbA1c, optimal triglyceride/HDL ratios, and reduced inflammatory cytokines.
My VAT area measured 15 cm², placing it within Dexalytics’ “very low” category. From a performance-therapy standpoint, minimal visceral fat translates to overall good metabolic and general health.
In athletes presenting with disproportionate VAT relative to total body fat (often > 80 cm² despite leanness elsewhere), the interventions shift from aesthetic fat reduction to systemic modulation: sleep, workload management, and recovery nutrition.

Integrating FFMI and ALMI into Performance Risk Profiling
The fat-free-mass index (FFMI), derived from Kouri et al., provides a physiologic ceiling for natural muscularity Kouri. Fat Free Mass Measures. Within their cohort, non-steroid users averaged FFMI = 21.8 ± 1.8 kg/m², with an upper limit near 25 kg/m².
This boundary has practical implications: in Dexalytics’ applied models, athletes with FFMI between 22 – 25 exhibit the best combination of strength output and movement efficiency. Below 20, mechanical resilience and energy availability begin to wane; above 26, excess lean mass can elevate oxygen cost and fatigue risk without proportional strength gains.
When combined, FFMI (total muscle quantity) and ALMI (functional distribution) form a dual-axis map of performance potential:
| Quadrant | FFMI | ALMI | Profile Interpretation |
|---|---|---|---|
| High FFMI / High ALMI | > 23 | > 9.0 | Strong, well-distributed muscle; elite readiness |
| High FFMI / Low ALMI | > 23 | < 8.5 | Mass concentrated in trunk; power without stability |
| Low FFMI / High ALMI | < 21 | > 9.0 | Lean athlete; efficient but low reserve — monitor fatigue |
| Low FFMI / Low ALMI | < 21 | < 8.5 | High injury susceptibility; prioritize hypertrophy |
Applying DEXA Insights to Injury Risk Management
- Sarcopenic Thresholds: Imboden’s sarcopenia cut-offs of 6.35 kg/m² (men) and 4.92 kg/m² (women) represent structural insufficiency points. Even subclinical declines toward 7.5–8.0 kg/m² should trigger strength diagnostics before symptomatic injury occurs.
- Symmetry Surveillance: Dexalytics identifies > 10 % asymmetry as a moderate-risk flag; > 15 % high-risk. Integrating DEXA data with isometric force profiles quantifies whether the asymmetry is morphological (mass) or neuromuscular (output).
- BMD Monitoring: Annual DEXA screening detects bone-density loss in athletes reducing impact volume (e.g., post-surgery). A T-score drop > 0.3 within a season should prompt mechanical-load reassessment.
- Lean-Mass Decline Tracking: Because Imboden observed a decade-based LM decrease of ~2–3 %, a quarterly decline > 1 % is significant. DEXA enables this sensitivity—well before visual cues or performance losses appear.
From DEXA Data to Training Design
A DEXA scan does not end with the report rather it begins a feedback loop. Once tissue quantity, symmetry, and density are quantified, the next step is engineering stress to drive adaptation in the direction the data suggest.
Imboden et al. (2017) documented a 2–3 % lean-mass decline per decade even in healthy adults. For athletes, that drift can occur faster under chronic energy deficit or unbalanced loading. Reversing or preventing it requires deliberate resistance training and sufficient nutrition. DEXA can monitor with precision every 10–12 weeks.
Dexalytics frameworks now categorize athletes into four action groups based on ALMI × FFMI profile:
| Profile Type | Primary Deficit | Programming Priority |
|---|---|---|
| High FFMI / Low ALMI | Poor limb distribution | Unilateral strength, single joint exercise |
| Low FFMI / High ALMI | Limited global reserve | Systemic hypertrophy & caloric support |
| Balanced Profile | Maintenance | Mixed block periodization, workload tracking |
| Low FFMI / Low ALMI | Structural deficit | Foundational hypertrophy & nutrition audit |
Each group receives a different blend of load, frequency, and energy targets—yet all hinge on the same principles: progressive tension, adequate protein, and sufficient recovery.
Nutritional Foundations for DEXA
Protein Intake and Distribution
Current consensus supports 1.6 – 2.2 g protein / kg body mass per day for athletes pursuing hypertrophy or tissue maintenance.
For an 82 kg individual, that equals 130–180 g/day, best divided into 3–5 meals providing ~0.4 g/kg (~40–60 g) high-quality protein per feeding. Leucine-rich sources (whey, lean meat, eggs) or complete plant combinations are preferred for maximizing muscle-protein synthesis.
Creatine Monohydrate
Few interventions demonstrate more consistent benefits for lean-mass accrual and mechanical output than creatine monohydrate. A maintenance dose of 3–5 g/day sustains intramuscular phosphocreatine stores.
Energy Availability
Lean-mass retention depends on adequate energy intake. Chronic restriction impairs anabolic signaling and bone metabolism. Athletes targeting recomposition should bias small surpluses (+200–300 kcal/day) during hypertrophy blocks, then re-assess composition via DEXA quarterly.
Hypertrophy and Load Prescription

The physiological ceiling set by Kouri et al. (1995) of FFMI ≈ 25 kg/m² for natural athletes defines not just a limit but a benchmark for efficiency To approach that ceiling responsibly, training must emphasize mechanical tension, volume progression, and recovery management—principles echoed in contemporary resistance-training science.
Mechanical Tension as the Primary Driver
- Use compound lifts and unilateral derivatives that sustain tension through lengthened muscle ranges.
- Maintain controlled eccentrics (2–4 s) and pause-isometrics to enhance torque under stretch.
- Train within 1–3 repetitions in reserve to balance tension stimulus and fatigue.
Volume and Frequency Progression
Empirical models indicate that 8–20 sets per muscle group per week maximizes hypertrophy in trained individuals. Practical periodization:
- Weeks 1–2: 8–10 sets / muscle group
- Weeks 3–4: 12–16 sets
- Weeks 5–6: 18–20 sets
- Week 7: Deload (~6–8 sets, low RPE)
Re-assess DEXA lean-mass distribution after each macrocycle. A ≥ 0.3 kg/m² increase in ALMI signifies a biologically meaningful adaptation beyond scan noise.
| Variable | Definition | Training Implication | Example Exercise Bias |
|---|---|---|---|
| Load | External resistance applied to a joint or muscle. | Heavy load ≠ high tension if torque is low. | Heavy partial squats = high load, low torque. |
| Torque | Rotational force = Load × horizontal distance from joint. | Increase torque by increasing lever arm (distance). | Preacher curl > incline curl for biceps tension. |
| Active Tension | Force created by muscle contraction. | Produced during concentric and isometric actions. | Pressing, curling, pulling. |
| Passive Tension | Force created by tissue stretch. | Occurs at end range; amplifies mechanical signal. | Deep squats, Nordics, flyes at stretch. |
| Optimal Growth Zone | High torque + long muscle length + near-failure effort. | Combine load and position for maximal stimulus. | Pendulum squat, seated hamstring curl, incline press. |
Conclusion: Precision as a Competitive Advantage
DEXA, when interpreted through validated frameworks offers far more than composition analysis. It quantifies capacity, symmetry, and structure, turning what was once a static image into a kinetic metric of performance health.
The application is clear:
- Track lean-mass symmetry (< 5 %) to minimize injury risk.
- Protect BMD through regular mechanical loading.
- Sustain adequate protein and energy availability to hold ALMI above athletic percentiles.
- Use DEXA quarterly to validate adaptation—not assume it.
At the elite level, where small margins define careers, precision is not luxury rather it is leverage. DEXA provides that leverage.
FREE DOWNLOAD
Start Optimizing Your Stem Cell Recovery Today with this Recovery Guide!
Watch More Like This
Read More Like This
Related Podcasts
References
- Imboden MT, Swartz AM, Finch HW, Harber MP, Kaminsky LA. Reference standards for lean mass measures using GE dual-energy x-ray absorptiometry in Caucasian adults. PLoS ONE. 2017;12(4):e0176161.
- Kouri EM, Pope HG Jr, Katz DL, Oliva P. Fat-Free Mass Index in Users and Nonusers of Anabolic-Androgenic Steroids.Clin J Sport Med. 1995;5(4):223-228.


