What Is the Acute:Chronic Workload Ratio?
The Acute:Chronic Workload Ratio (ACWR) is a quantitative method for tracking and managing an athlete’s training load over time. It compares how much work an athlete has done recently against how much work their body is conditioned to handle giving you a data-driven signal of whether they are at risk of breakdown or progressing safely.
The formula is straightforward:
ACWR = Acute Load ÷ Chronic Load
- Acute Load represents the training stress accumulated over a short recent window (typically 3–7 days). Think of this as what the body is experiencing right now.
- Chronic Load represents the rolling average workload over a longer period (typically 2–5 weeks). Think of this as what the body is prepared for.
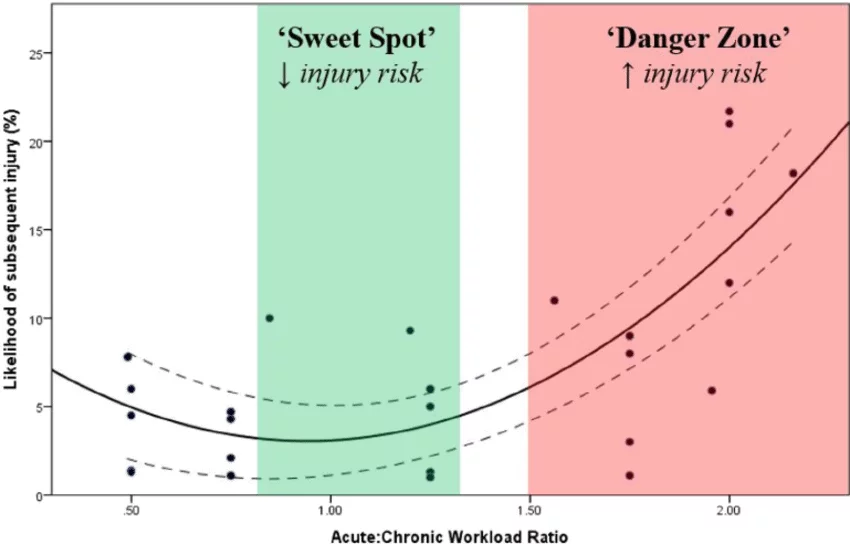
When the acute load significantly outpaces the chronic load, the athlete is doing more than their body is built to absorb and that is where injury risk spikes. Conversely, if the ratio is too low, the athlete may be undertraining relative to their capacity.
ACWR and the 3P Model: The Principle of Exposure
Within the 3P Model of injury and performance, ACWR sits squarely under the principle of Exposure. Exposure refers to the cumulative stress placed on biological tissues over time. This includes the total dose of mechanical, metabolic, emotional, and neuromuscular demand that a body absorbs through training and competition.
Exposure is not inherently harmful. In fact, progressive, well-managed exposure is precisely what drives tissue remodeling, strength adaptation, and long-term resilience. The problem arises when Exposure spikes and when the body encounters a load it has not been systematically prepared to handle.
ACWR is your primary tool for managing Exposure. It transforms a vague concept (‘they’ve been training a lot’) into a measurable, actionable number. It allows you to track load trajectories across weeks, identify spikes before they cause symptoms, and build the kind of evidence-based case that resonates with athletes, coaches, and medical teams alike.
Understanding Training Load
Training Load is the foundation of every ACWR calculation. It is calculated as:
Training Load = RPE × Duration (minutes)
RPE (Rate of Perceived Exertion) is measured on a 1–10 scale collected 20–30 minutes post-session when the athlete’s perception of effort has stabilized. This session RPE method has become a gold standard for internal load monitoring because it requires no equipment, integrates physical and psychological stress, and is sensitive to fatigue accumulation.
RPE Scale Reference
| RPE | Description |
| 1 | Rest / No exertion |
| 2 | Very, very easy |
| 3 | Easy |
| 4 | Moderate, could sustain for hours |
| 5 | Somewhat hard |
| 6 | Hard |
| 7 | Very hard. breathing heavily, conversation difficult |
| 8 | Very, very hard, near maximal effort |
| 9 | Maximal, cannot sustain |
| 10 | Absolute maximum, all-out sprint, max lift |
ACWR Zones: Interpreting the Number
The ACWR number itself is only useful if you know how to interpret it. Research — particularly from Tim Gabbett’s foundational work in professional sport — has identified the following zones as meaningful thresholds for injury risk:
| ACWR Range | Zone | Interpretation | Action |
| < 0.8 | Under-Training | Chronic load far exceeds acute — athlete may be deconditioned or underprepared. | Gradually increase training volume. |
| 0.8 – 1.3 | Sweet Spot ✓ | Acute load is well-matched to chronic capacity — optimal training zone. | Maintain. This is the target range. |
| 1.3 – 1.5 | Caution | Acute load is outpacing chronic base — injury risk beginning to rise. | Reduce volume or intensity. Monitor closely. |
| > 1.5 | Danger Zone | Acute load significantly exceeds chronic capacity — high injury probability. | Immediate load reduction required. |
Note: The 0.8–1.3 ‘sweet spot’ represents the range where fitness adaptations are occurring without disproportionate injury risk. The goal is not to keep the ratio as low as possible — that would mean undertraining. The goal is to keep it within this range while progressively raising the chronic base over time.
How to Use the ACWR Calculator
Step 1: Enter Daily Training Data
Open the Data sheet. For each training day, fill in the following four fields:
- The calendar date of the session.
- A label describing the type of training (e.g., Strength, Conditioning, Field Work, Recovery, Game).
- The total active training time in minutes. Do not include warm-up and cool-down unless they represent meaningful physical stress.
- Collected 20–30 minutes post-session. Ask a simple question: “On a scale of 1–10, how hard was that session overall?”
The spreadsheet automatically calculates Training Load (RPE × Duration) for each session. Rest days can be logged as 0.
Step 2: Configure Your Windows on the Settings Sheet
The Settings sheet allows you to customize the time windows used to calculate acute and chronic load, which is a critical step for individualizing the tool to your athlete’s training cycle.
- This is how many recent days define your ‘right now’ load. A 7-day acute window is standard for most sport settings. Shorter windows (3–5 days) are more reactive and useful for detecting sudden spikes in high-load phases.
- This is the rolling average that represents the athlete’s fitness base. A 28-day (4-week) chronic window is the most commonly researched and clinically validated. Shorter windows can be used early in a training block when data is limited.
As a starting point for most athletes, use a 7-day acute window and a 28-day chronic window. Adjust from there based on the sport, training frequency, and what phase of the season you’re in.
Step 3: Monitor the Risk Zone Column
The ACWR column updates automatically as you log data. The Risk Zone column uses conditional formatting to flag the current status:
- ACWR is in the 0.8 – 1.3 sweet spot. Training load is appropriately matched to capacity.
- ACWR is approaching or slightly below the safe range. Monitor closely and adjust if trending toward red.
- ACWR exceeds 1.5. This is a high-risk flag. Reduce acute load immediately.
Do not wait for the athlete to report symptoms before responding to a red zone flag. ACWR is a leading indicator and it captures risk before pain or breakdown occurs.
Step 4: Use Trends, Not Single Data Points
A single ACWR reading is informative, but the trajectory over time is where the real insight lives. Look for:
- Rapid rises over 2–3 consecutive days and a spike in progress toward or past 1.5 is a more urgent signal than a single elevated reading.
- Prolonged time below 0.8 tmay indicate chronic underloading, recovery from illness, or a deload phase that needs to transition back to progressive loading.
- Volatility or large week-to-week swings suggest inconsistent training habits or poor load management. Consistent, gradual chronic load progression is the signature of well-managed athletes.
Clinical Application: Using ACWR in Practice
With Athletes
Make ACWR data visible. Athletes respond well to numbers and it transforms abstract coaching principles into concrete feedback. Show them their ratio. Explain why you’re modifying a session. Build their literacy around load management so they can self-regulate during unsupervised training.
With Coaches
ACWR gives you a shared language with coaching staff. Rather than saying ‘I think they’re doing too much,’ you can say ‘Their ACWR hit 1.7 last Thursday and stayed above 1.5 through the weekend, we need to look at next week’s volume.’ Data-driven conversations land differently.
In Return-to-Sport Protocols
ACWR is particularly powerful in rehabilitation. As an athlete transitions from rehab to full training, ACWR ensures their re-loading progression stays within the safe zone. A common error is returning athletes to full practice before their chronic base has been rebuilt. ACWR makes this mistake visible before it causes re-injury.
In Your Documentation and Programming
Record ACWR data as part of athlete case files. If an injury occurs, having load data creates a clear clinical picture. If programming is optimized and an athlete stays healthy through a demanding season, load data tells that story too. It is both a clinical protection tool and a demonstration of your methodology.
5 Common Mistakes to Avoid
- Wait 20–30 minutes post-training for accurate perception. Immediate post-session RPE is often inflated by acute fatigue.Using RPE immediately after the session.
- A day with no training is still a data point. Log zero-load days to ensure your rolling averages are calculated accurately.Ignoring rest days.
- Some practitioners assume lower is always better. Chronically low ACWR indicates undertraining, not safety. The goal is consistent time in the 0.8–1.3 window.
- A field sport athlete training 6 days/week needs different settings than a strength athlete training 3 days/week. Customize your windows accordingly.
- ACWR is one lens within the 3P Model. Always integrate it with sleep, stress, nutrition, or movement quality with any existing Pathology. A high ACWR in a healthy, resilient athlete carries different weight than the same number in an athlete who is already managing tissue damage.