Approximate Read Time: 32 minutes + FREE Download
“The same performance standards that extend longevity also protect athletes — strength, muscle mass, and fitness aren’t optional; they’re the baseline.”
What You will learn
- Relative strength protects athletes from injury and increases longevity.
- Jump and power metrics create benchmarks for rehab and sport readiness.
- Body composition standards link healthspan and training load tolerance.
- Aerobic fitness moderates injury risk and supports return-to-play durability.
- Embedded testing transforms profiling from reactive measurement to proactive decision-making.
The Problem with “It Depends”
Every performance coach, physical therapist, and sports scientist has been there — an athlete, coach, or GM asks: “Is this player ready?”
And our instinctive answer? “It depends.”
We use it because human performance is messy. No two athletes are the same. Context matters. But here’s the truth — in professional sports, “it depends” doesn’t fly. Coaches, agents, and executives aren’t asking for a philosophical musing. They want facts. They want standards. They want data they can trust to make million-dollar decisions.
When I built my From Data to Dominance presentation for Spooner Sports Medicine, one slide captured the frustration:
Yes, it’s science AND art… Yes, humans are complex… But GMs, Agents, and Players don’t want art… They want facts.
The solution isn’t stripping away nuance — it’s upgrading “it depends” into evidence-based decision-making. That upgrade comes from knowing the objective standards that matter, tracking them over time, and applying them consistently — not just when an athlete is coming back from injury, but in preseason, in-season, and across their career.
And here’s the key: the same metrics that guide safe return-to-play are the metrics that prevent injuries and extend careers in the first place. That’s where the 360 Performance Profile comes in.
The Longevity-Performance Link
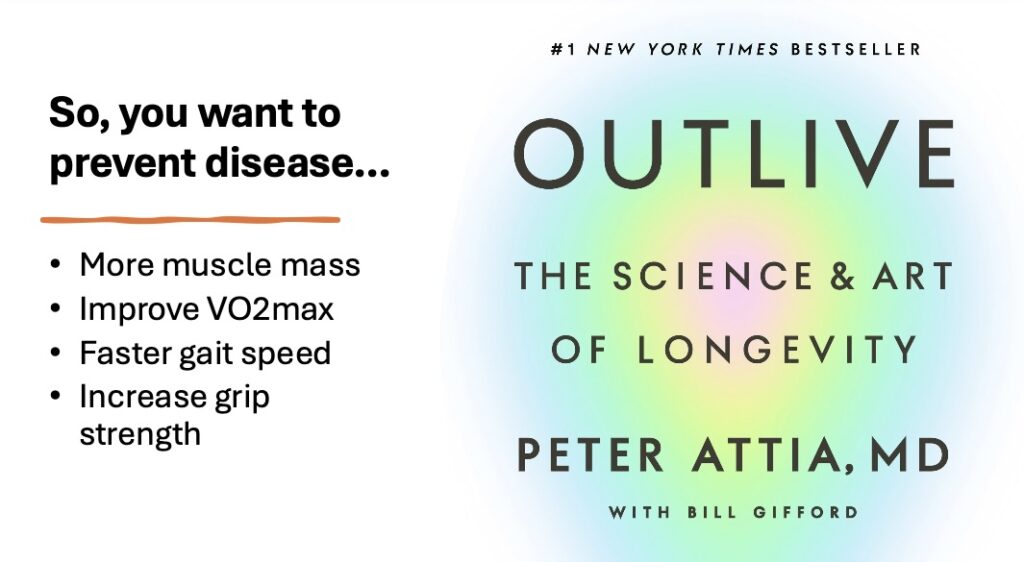
In longevity medicine, the focus is simple: extend healthspan — the number of years a person can live independently and at high function. The variables that drive that outcome are surprisingly similar to those that keep athletes on the field.
- More muscle mass
- Higher VO₂max
- Faster gait speed
- Greater grip strength
- Lower body fat percentage
The kicker? These aren’t “old-person” metrics. They are durability metrics.
If you’re a 31-year-old midfielder in the NWSL, your ability to tolerate congested fixtures is directly tied to your aerobic capacity, your relative strength, and your muscle mass. The same ALMI (Appendicular Lean Mass Index) that predicts fall risk in older adults is the same indicator of who may be at increased risk for injury.
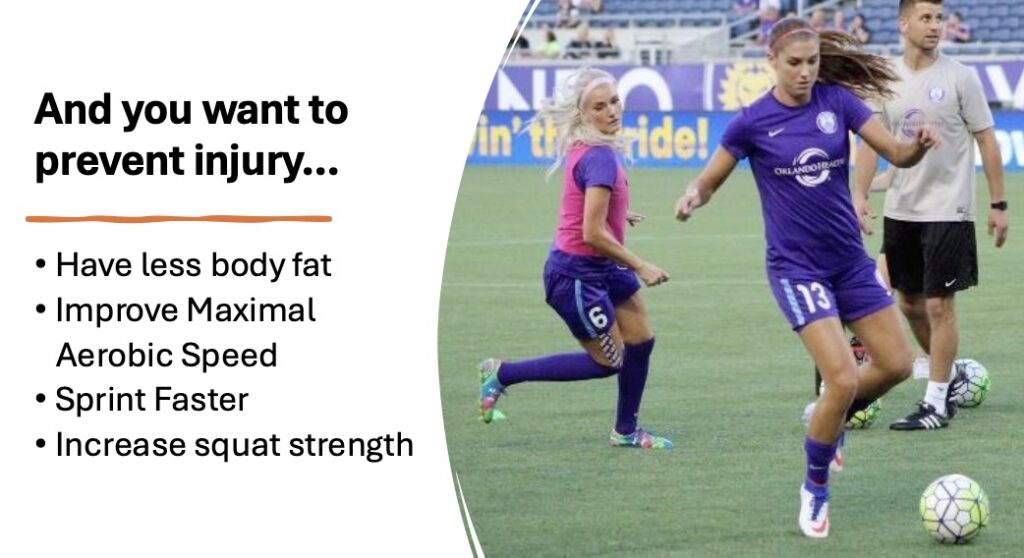
Imboden et al. (2017) showed that ALMI declines with age, and lower quartiles are associated with reduced physical function. Malone & Gabbett (2018) found that aerobic fitness moderated injury risk when players faced acute workload spikes. It’s the same science — different jerseys.
The first mental shift is this — injury prevention and performance aren’t separate goals. The physiological qualities that keep people alive longer are the same ones that keep athletes available, durable, and performing.
Relative Strength as a Foundation
If I could pick one metric that almost everyone understands, it would be relative strength — how much force they can produce relative to their bodyweight. Here are two key points we need to consider:
- It’s a proxy for tissue capacity — stronger muscles and connective tissues handle more load before reaching their failure point.
- It moderates risk when workloads spike — the same 30% increase in high-speed running is less dangerous for a strong athlete than a weak one.
What does the research support?
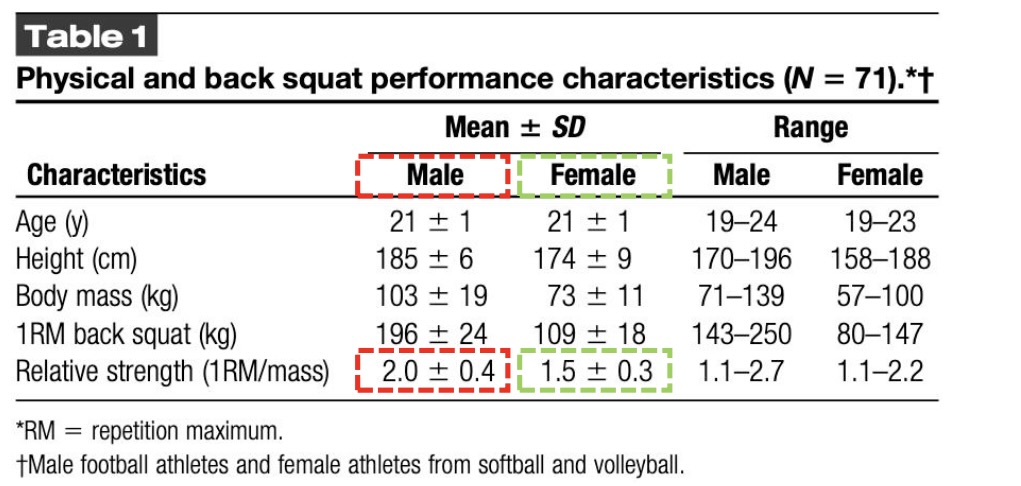
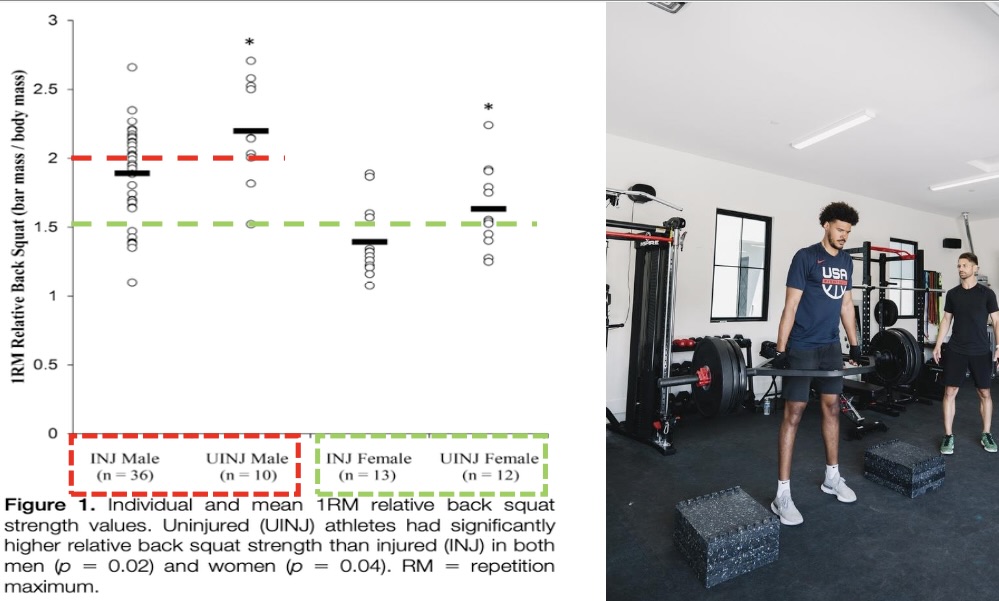
- Case et al. (2020) found male athletes below ~2.2× bodyweight squat and female athletes below ~1.6× BW had higher seasonal lower extremity injury rates.
- Malone et al. (2018) showed stronger hurling players of 2.5 – 2.9x bodyweight trap bar deadlift tolerated larger week-to-week workload changes without the injury risk weaker peers faced.
Return-to-play crossover:
In ACL rehab, we use isokinetic quadriceps peak torque ≥1.0× BW as a clearance standard. That’s not “elite” — it’s “safe enough to compete.” If it’s safe enough for an athlete post-surgery, why wouldn’t we expect it from every healthy player?
- Extension isometric @60°: 120% BW
- Flexion isometric @45°: 85% BW
- Hamstring:Quad isometric ratio: 70%
- Squat 3RM @0.3–0.4 m/s: ≥1.5× BW
In preseason, screen every athlete for relative strength. If they’re below RTP clearance norms, they’re starting the season in the red.
Jump Profiling and Power Standards
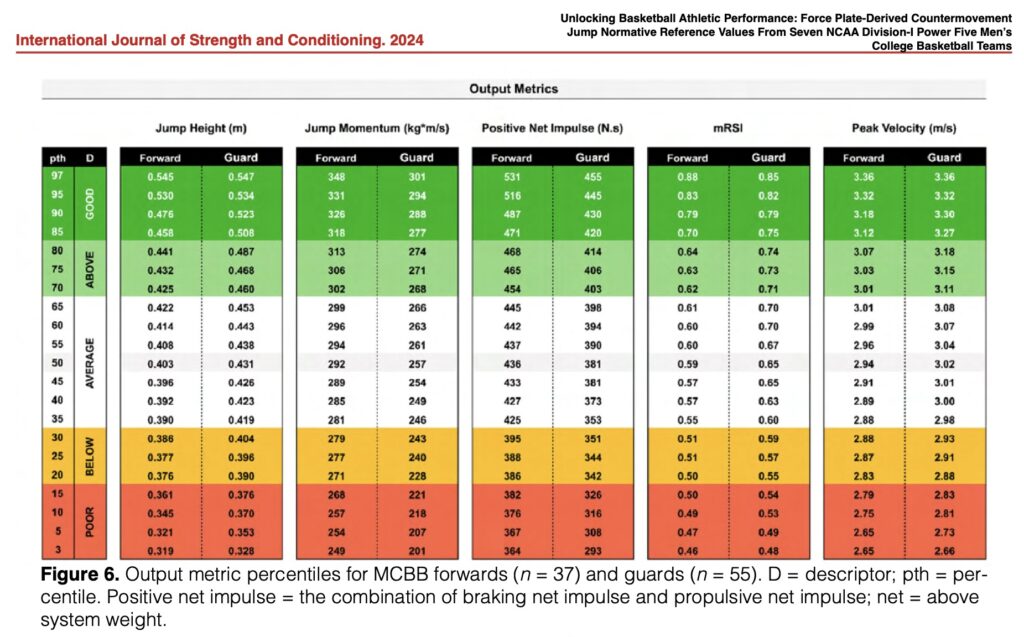
The countermovement jump (CMJ) is more than a “jump test” — it’s a force-velocity fingerprint. It tells you how an athlete produces force, absorbs force, and uses the stretch-shortening cycle.
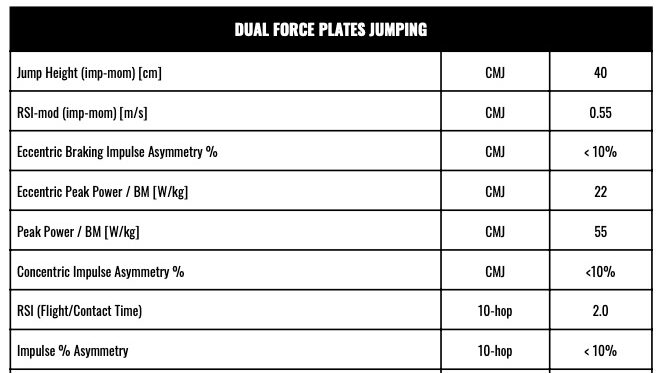
Seen in the above image, The NCAA Division-I basketball force plate study (2024) gives positional percentiles for jump height, reactive strength index (RSI), and peak power that help create standards for performance and injury prevention.
- Jump height (CMJ, impulse-momentum): ≥40 cm
- RSI-mod: ≥0.55 m/s
- Eccentric peak power/BW: ≥22 W/kg
- Peak power/BW: ≥55 W/kg
- Asymmetries: <10%
In preseason, CMJ data should be used to establish clear percentile benchmarks for each athlete, setting a performance target from day one. During rehab, those same metrics become objective milestones that guide safe progression back to unrestricted training. In-season, tracking for sudden drops can flag fatigue or warn of an impending performance decline before it’s visible on the pitch.
Body Composition Benchmarks
Body composition is often treated as an aesthetic metric. In reality, lean mass — particularly ALMI — is a performance and durability marker.
Imboden et al. (2017) provided ALMI reference values by age and sex.
Low ALMI means less muscle mass. Less muscle mass mean:
- Lower tissue capacity
- Reduced tolerance to high chronic loads
- Higher injury risk under acute spikes
A valuable resource and website I have come to frequent is DEXAlytics. This website uses advanced analysis to evaluate body composition through whole body DEXA scans. Below is a sample of some of the data they are providing that can help us create standards for body composition:
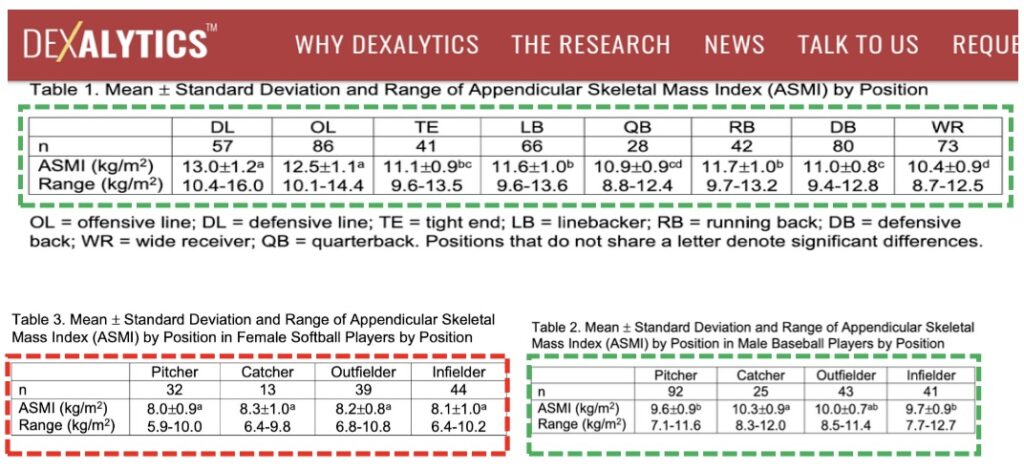
Consider this perspective. A winger in MLS may need to maintain ALMI above league median to buffer repeated sprint demands. A center back might need even higher to absorb contact loads. Position specificity can help guide the nuance, yet across an entire sport there may be relevant ranges every athlete should strive for.
Aerobic Fitness and Injury Risk
Aerobic fitness is the unsung moderator of injury risk. It’s not just about running longer — it’s about tolerating more work with less physiological stress. Let’s look at the numbers:
- Malone & Gabbett (2017) MAS ≥4.8–5.1 m/s reduced injury risk from acute:chronic workload spikes.
- Mandsager (2018) VO₂max thresholds in longevity research (≥50 mL/kg/min in women, ≥55 mL/kg/min in men) suggest ELITE categories for improved lifespan.
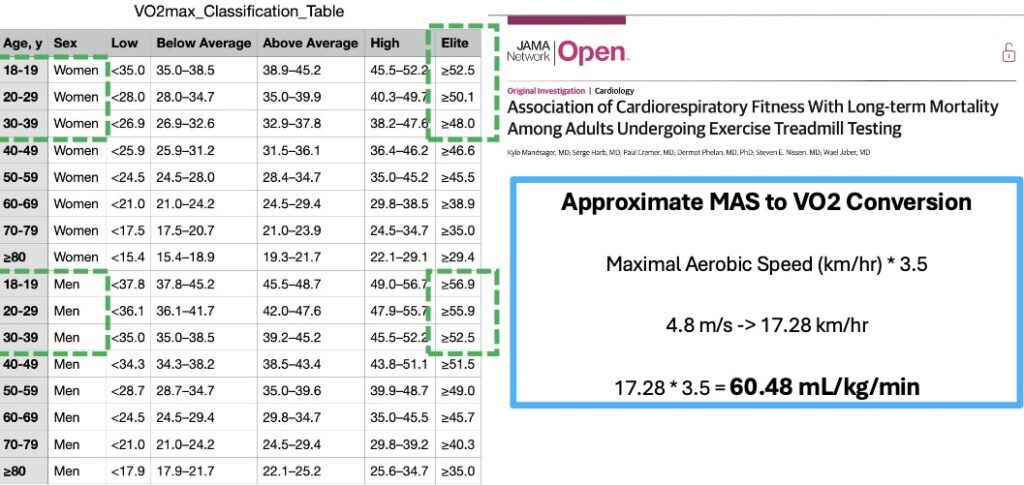
In a practical setting, do this. Test MAS or Yo-Yo Intermittent Recovery Level 2 in preseason. Use results to:
- Set individual conditioning targets.
- Suggest individual tolerance to fixture or game congestion.
Asymmetry Tolerances and Return-to-Play Standards
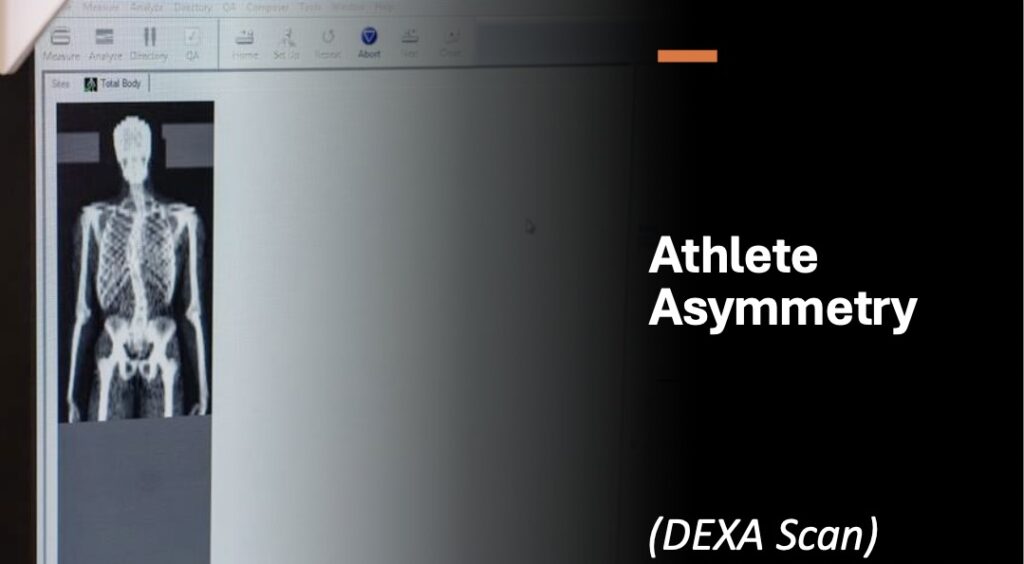
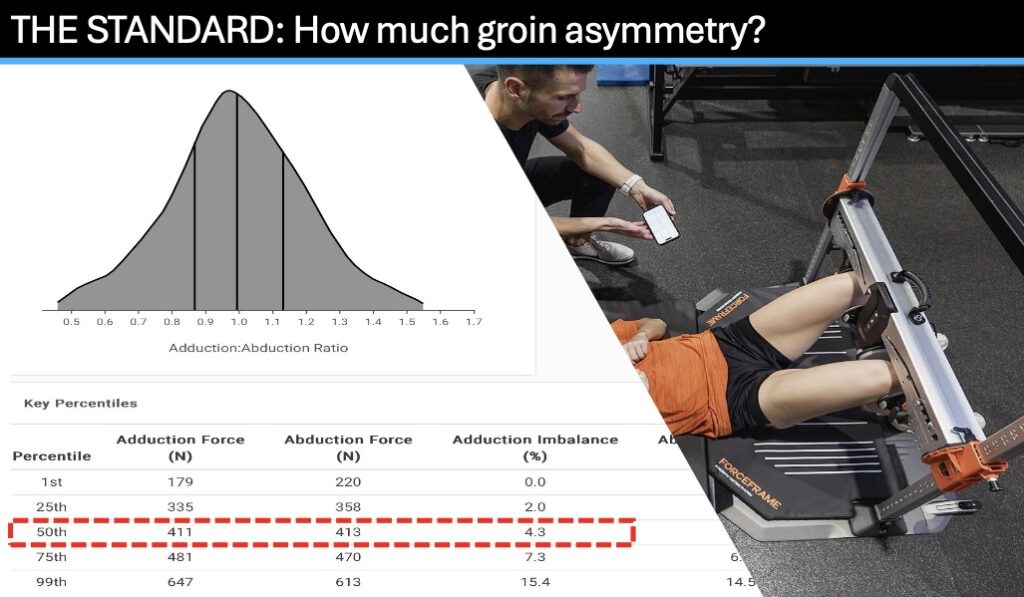
Asymmetry thresholds are one of the simplest, most transferable metrics we have. A universal standard that most professional will accept is <10% asymmetry for key tests (NordBord hamstrings, groin adduction/abduction, CMJ impulses). Whether in force plate jumps, groin squeeze tests, or hamstring isometrics, higher asymmetry correlates with higher injury risk and slower RTP.
- NordBord Max force asymmetry: <10%
- Groin squeeze asymmetry: <10%
- CMJ impulse asymmetry: <10%
If we trust <10% to clear an athlete post-injury, it should be our yellow-flag threshold in every preseason and in-season screen.
Embedded Testing: Moving Beyond Pre/Post
Old model: train for 6 weeks, stop everything, test, return to training.
Problem: It’s disruptive, and it gives you two data points to guess from.
Modern model: embedded testing — short, repeatable assessments built into warm-ups, lifts, or recovery days.
Embedded testing offers the advantage of more frequent check-ins without adding significant fatigue. It creates immediate feedback loops that allow coaches to adjust in real time. Over weeks and months, those repeated data points form trend lines that reveal the true story of an athlete’s progress, not just isolated snapshots.
Here are a few practical examples of how to leverage embedded testing:
- Weekly CMJ on force plates before lift.
- Monthly isokinetic or groin squeezes.
- Periodic sub-maximal Yo-Yo Intermittent Recovery Test.
The 360 Performance Profile in Action
Imagine a 23-year-old midfielder reporting for preseason:
- Squat 3RM: 1.35× BW (below 1.5× standard)
- CMJ peak power/BW: 52 W/kg (below 55 W/kg)
- ALMI: 10.5 kg/m² (slightly below 10.9 standard)
- MAS: 4.7 m/s (below 4.8 standard)
- NordBord asymmetry: 8% (within standard)
The first training block zeroed in on closing the biggest gaps: relative strength and aerobic capacity. Strength work built the tissue resilience needed to handle match load, while targeted conditioning pushed the aerobic system toward MAS benchmarks.
Throughout the block, embedded CMJ testing acted as a weekly pulse check, ensuring power output wasn’t sacrificed for fitness gains. By mid-season, the athlete’s MAS had climbed to 4.9 m/s and squat strength reached 1.55× bodyweight — now above return-to-play safety norms. Those upgrades didn’t just tick boxes; they gave the athlete the durability to absorb a congested fixture list without breaking stride.
Conclusion: Upgrading the Standard
The upgrade is using objective, research-backed standards as the language of decision-making.
The same benchmarks that tell us when an ACL graft can handle game load should tell us whether a healthy player is starting the season ready — or at risk.
The standards:
- Relative Strength – ≥1.5× BW squat, ≥1.0× BW isokinetic quad torque.
- Power – CMJ ≥40 cm, peak power/BW ≥55 W/kg, asymmetries <10%.
- Body Composition – ALMI in top quartile for sex/position.
- Aerobic Fitness – MAS ≥4.8–5.1 m/s.
- Symmetry – <10% on key metrics.
When we apply them consistently — preseason, in-season, rehab — we turn “it depends” into “here’s the data.”

Free Download:
Read More About This:

Deeper Dives with these Podcast Episodes

References
- Schwery NA, Kiely MT, Larson CM, et al. Quadriceps strength following anterior cruciate ligament reconstruction: normative values based on sex, graft type, and meniscal status at 3, 6 & 9 months. Int J Sports Phys Ther.2022;17(3):434-444. doi:10.26603/001c.32378.
- Berberet D, Petway A, Bell K, et al. Unlocking basketball athletic performance: force plate-derived countermovement jump normative reference values from seven NCAA Division-I Power Five men’s college basketball teams. Int J Strength Cond. 2024;4(1). doi:10.47206/ijsc.v4i1.354.
- Imboden MT, Swartz AM, Finch HW, Harber MP, Kaminsky LA. Reference standards for lean mass measures using GE dual energy X-ray absorptiometry in Caucasian adults. PLoS One. 2017;12(4):e0176161. doi:10.1371/journal.pone.0176161.
- Malone S, Roe M, Doran DA, Gabbett TJ, Collins KD. Aerobic fitness and playing experience protect against spikes in workload: the role of the acute:chronic workload ratio on injury risk in elite Gaelic football. Int J Sports Physiol Perform. 2017;12(3):393-401. doi:10.1123/ijspp.2016-0090.
- Case MJ, Knudson DV, Downey DL. Barbell squat relative strength as an identifier for lower extremity injury in collegiate athletes. J Strength Cond Res. 2020;34(5):1249-1253. doi:10.1519/JSC.0000000000003536.
- Malone S, Hughes B, Doran DA, Collins K, Gabbett TJ. Can the workload–injury relationship be moderated by improved strength, speed and repeated-sprint qualities? J Sci Med Sport. 2018;21(3):257-262. doi:10.1016/j.jsams.2017.07.017.
- Hulin BT, Gabbett TJ, Lawson DW, et al. The acute:chronic workload ratio predicts injury: high chronic workload may decrease injury risk in elite rugby league players. Br J Sports Med. 2016;50(4):231-236. doi:10.1136/bjsports-2015-094817.
- Mandsager K, Harb S, Cremer P, Phelan D, Nissen SE, Jaber W. Association of cardiorespiratory fitness with long-term mortality among adults undergoing exercise treadmill testing. JAMA Netw Open. 2018;1(6):e183605. doi:10.1001/jamanetworkopen.2018.3605.

